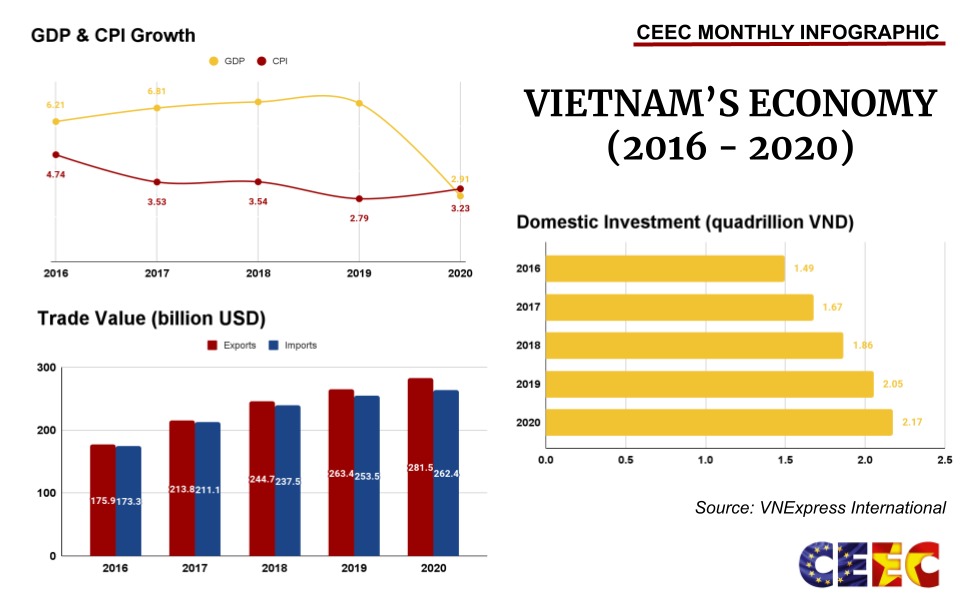
This month, CEEC brings you an infographic that illustrates Vietnam’s economic performance changes over the last 5 years (2016-2020). The key points that are shown in the infographic are GDP & CPI growth, Trade value, and Domestic Investment.
GDP Growth of Vietnam changed significantly in the five-year period. After reaching the peak of 7.08% in 2018, Vietnam was expected to have an increasing GDP rate year by year. Yet, the GDP growth slightly fell down to 7.02% in the following year (2019) and notably decreased to 2.91% last year (2020) as being heavily affected by the spread of Covid-19.
Similarly, over the last 5 years, Vietnam experienced the fluctuation of CPI. As of 2016, the CPI was recorded to be 4.74%, which was the highest number in the five-year period. In later years, the number gradually went up and down, and the lowest CPI was reported to be 2.79% in 2019.
Differ from that, the trade value of Vietnam kept increasing throughout the years. Even though Covid-19 showed up as a challenge for international trade, export and import turnovers of Vietnam was not facing a huge decline. In 2020, the export value reached 281.5 billion USD while the import value was 262.4 billion USD. The implementation of the Free Trade Agreement between the EU and Vietnam (EVFTA) helped to boost export and import activities.
The slight increase in domestic investment every year is another good sign for Vietnam’s economy. At the beginning of the five-year period, the domestic investment value was 1.49 quadrillion VND. From there, it slowly jumped up to 2.17 quadrillion VND in 2020.
Source: VNExpress International